Onboarding und Training, die begeistern - eSquirrel business
eSquirrel making textbooks playable

Learning analytics

Learning-Analytics-blog-titelbild

Share This Post

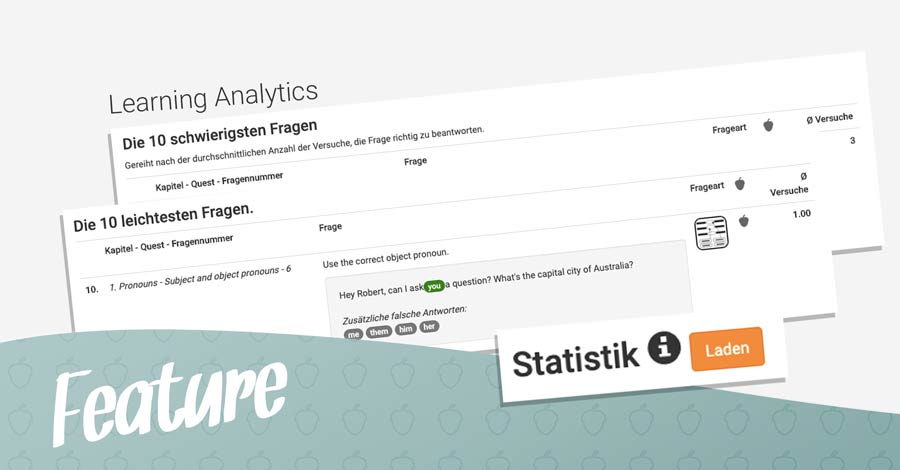
With Learning analytics, you can see at a glance what your students are still struggling with and what they have already mastered. This helps you to tailor your lessons exactly to the needs of your students. The 10 easiest and the 10 most difficult questions are also listed.

Here’s how:

In the teacher’s portal, click on the course or book whose statistics you want to view. You will be taken directly to the “Achievments”. There you will find the heading “Learning Analytics” at the bottom of the page. Next to it, click on “Load” and you will get an evaluation of the questions.

In the evaluation, you will then see the question from the quest in the respective chapter, the question itself (incl. solution), the question type, the maximum achievable acorns and the average attempts needed for this question. According to this, these questions are also ranked.

Sie möchten am Laufenden bleiben?

Registrieren Sie sich jetzt für unseren Newsletter!

Mehr zum Entdecken

Bildungsinnovationsdialog

BID – Gemeinsam Bildung stärken

Wir möchten Sie über eine Initiative aus der Zivilgesellschaft informieren, die das österreichische Schulsystem grundlegend, langfristig und nachhaltig reformieren möchte. Dies wird doch schon seit Jahrzehnten versucht, sagen Sie zu Recht. Was ist jetzt der Unterschied?

Do You Want To Boost Your Business?

drop us a line and keep in touch